Welcome to Regression Alert, your weekly guide to using regression to predict the future with uncanny accuracy.
For those who are new to the feature, here's the deal: every week, I break down a topic related to regression to the mean. Some weeks, I'll explain what it is, how it works, why you hear so much about it, and how you can harness its power for yourself. In other weeks, I'll give practical examples of regression at work.
In weeks where I'm giving practical examples, I will select a metric to focus on. I'll rank all players in the league according to that metric and separate the top players into Group A and the bottom players into Group B. I will verify that the players in Group A have outscored the players in Group B to that point in the season. And then I will predict that, by the magic of regression, Group B will outscore Group A going forward.
Crucially, I don't get to pick my samples (other than choosing which metric to focus on). If I'm looking at receivers and Justin Jefferson is one of the top performers in my sample, then Justin Jefferson goes into Group A, and may the fantasy gods show mercy on my predictions.
And then because predictions are meaningless without accountability, I track and report my results. Here's last year's season-ending recap, which covered the outcome of every prediction made in our seven-year history, giving our top-line record (41-13, a 76% hit rate) and lessons learned along the way.
Our Year to Date
Sometimes, I use this column to explain the concept of regression to the mean. In Week 2, I discussed what it is and what this column's primary goals would be. In Week 3, I explained how we could use regression to predict changes in future performance-- who would improve, who would decline-- without knowing anything about the players themselves.
Other times, I use this column to make specific predictions. In Week 4, I explained that touchdowns tend to follow yards and predicted that the players with the highest yard-to-touchdown ratios would begin outscoring the players with the lowest.
The Scorecard
| Statistic Being Tracked | Performance Before Prediction | Performance Since Prediction | Weeks Remaining |
|---|---|---|---|
| Yard-to-TD Ratio | Group A averaged 17% more PPG | Group B averages 57% more PPG | 3 |
I always say you shouldn't read too much into standings after a single week; the reason we track this for a month is to give performance time to stabilize. Group B probably won't outscore Group A by 57% on this prediction. (The average outcome is Group B by 18%, and the largest win was Group B by 47%.)
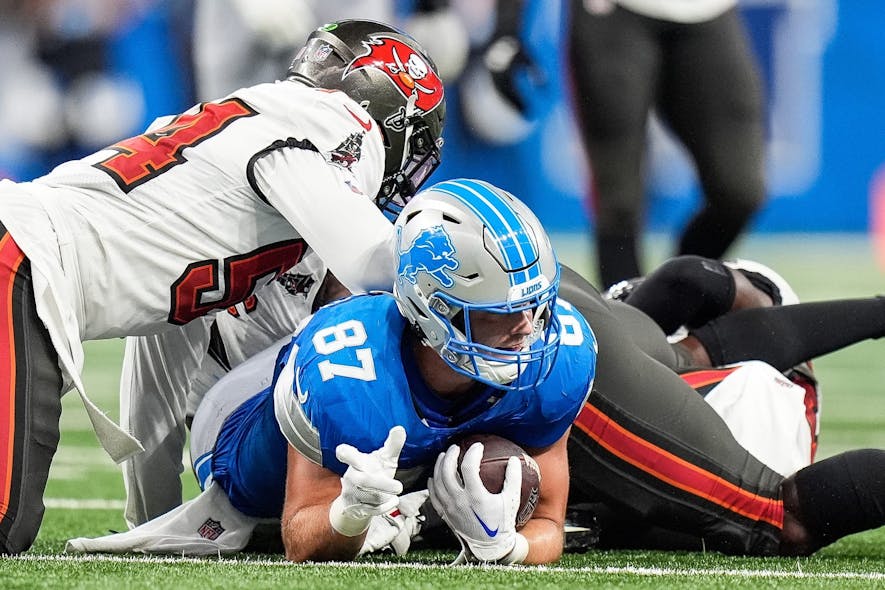
But it's always amazing how quickly the touchdowns swing on this prediction. Heading into last week, Group A receivers averaged 0.86 touchdowns per game and Group B averaged 0.33. If you count Amon-Ra St. Brown's passing touchdown, last week Group B averaged 0.88 touchdowns per game and Group A averaged 0.33-- as perfect of a reversal as we could get.
(I don't count the passing touchdown in St. Brown's yard-to-touchdown ratio-- though I do count Stefon Diggs' rushing touchdown for Group A-- which means Group B "only" averaged 0.75 touchdowns per game for the week. I did appreciate the symmetry, though.)
Revisiting Preseason Expectations
In October of 2013, I wondered just how many weeks it took before the early-season performance wasn't a fluke anymore. In "Revisiting Preseason Expectations", I looked back at the 2012 season and compared how well production in a player's first four games predicted production in his last 12 games. And since that number was meaningless without context, I compared how his preseason ADP predicted production in his last 12 games.
I didn't realize at the time that this would turn Week 5 into my own personal Groundhog Day.
It was a fortuitous time to ask that question, as it turns out, because I discovered that after four weeks in 2012, preseason ADP still predicted performance going forward better than early-season production did.
This is the kind of surprising result that I love, but sometimes results are surprising because they're flukes. So, in October of 2014, I revisited "Revisiting Preseason Expectations". This time, I found that in the 2013 season, preseason ADP and week 1-4 performance held essentially identical predictive power for the rest of the season.
With two different results in two years, it was time for a tiebreaker. In October of 2015, I revisited my revisitation of "Revisiting Preseason Expectations". This time, I found that early-season performance held a slight predictive edge over preseason ADP. Then in October of 2016, I decided to revisit my revisitation of the revisited "Revisiting Preseason Expectations". As in 2015, I found that this time, early-season performance carried slightly more predictive power than ADP.
To no one's surprise, I couldn't leave well enough alone in October 2017, once more revisiting the revisited revisitation of the revisited "Revisiting Preseason Expectations". This time I once again found that preseason ADP and early-season performance were roughly equally predictive, with a slight edge to preseason ADP.
Now fully a creature of habit, when October 2018 rolled around, I simply had to revisit my revisitation of the revisited revisited revisitation of "Revisiting Preseason Expectations". And then in October 2019 and October 2020 and October 2021 and October 2022 and October 2023 I... well, you get the idea.
And now, as you've probably guessed, it's time for an autumn tradition as sacred as turning off the lights and pretending I'm not home on October 31st. It's time for the twelfth annual edition of "Revisiting Preseason Expectations"! (Or as I prefer to call it, "Revisiting Revisiting Revisiting Revisiting Revisiting Revisiting Revisiting Revisiting Revisiting Revisiting Revisiting Revisiting Preseason Expectations".)


