Welcome to this new, weekly Draftkings feature on Footballguys. As the title suggests, the goal of this feature is to predict how DFS professionals will tweak their player exposures -- in either a bullish (or bearish) direction -- for the Sunday Main slate on Draftkings.
But who are the DFS professionals?
The pro roster percentages you will see in the tables below are based on a statistical algorithm that attempted to differentiate elite DFS players on Draftkings from the rest of the population. Based on a multitude of factors, this algorithm identified 205 "professionals" who play in low-to-mid stakes Guaranteed Prize Pool (GPP) tournaments. The primary characteristics that differentiated them were their percentage of max entry and their median top finish in a contest. Specifically, the vast majority of pros enter at least 90% of the entry maximum in a given GPP. If the contest allows for 150 lineups, they enter at least 135; if it allows for 20 lineups, they enter at least 18; etc. In addition, the vast majority of pros have their highest-finishing lineup end up in the Top 4% of entries in a given context.
In short, a low-to-mid stakes Draftkings GPP pro appears to be a player who plays the percentages more optimally than the rest. They apply a ton of volume, what's called "mass multi-entry" in a DFS context, and diversify their lineups enough to make it more likely than not that at least one entry finishes near the top of the standings -- where payouts are highest.
OK, but how can one possibly project the mass multi-entry roster percentages pros use to effect this profitable strategy?
Well, it turns out that, based on an analysis of historical contest entry data, pros reliably increase or decrease their exposures to players according to a small number of factors. The effects of these factors differ across positions, but a surprisingly short list gets you most of the way there:
- Steve Buzzard's projected roster percentages. The higher Buzzard's projection, the higher a pro roster percentage will be for a given player.
- This author's value probabilities. This system uses salaries and Footballguys' point projections to calculate the likelihood that players achieve the 4x GPP value threshold (e.g., a $4,000 player must score 16 points to achieve value). The higher the value probability, the higher a pro roster percentage will be for a given player.
- Projected roster percentage for the opponent's defense. The lower Buzzard's projection for a defense, the higher a pro roster percentage will be for a given player facing that defense.
- For quarterbacks and running backs, projected roster percentage for the same team's wide receivers. The higher Buzzard's projection for a wide receiver, the higher a pro roster percentage will be for his quarterback. The opposite is true for running backs.
- For defenses, projected roster percentage for the opponent's quarterback. The lower Buzzard's projection for a quarterback, the higher a pro roster percentage will be for a given defense facing that quarterback.
If one were to step back and view these factors affecting pro roster percentages from 30,000 feet, one will notice the following: Pros gain their edge by exploiting inefficiencies in the interactions between positions. For example, they see a quarterback and their opposing defense both projected for a low roster percentage and realize that can't be correct. If the defense does well, the quarterback won't; and vice versa. One should be highly rostered and the other not. This observation is intuitive and not reflective of some wizardly wisdom. Rather, what sets the pros apart is that, by virtue of their mass multi-entry strategy, they're able to finely tune their exposures to the quarterback and defense in this example.
So with the methods of this madness explained, it's time to try to project the pros, one position at a time.
quarterbacks
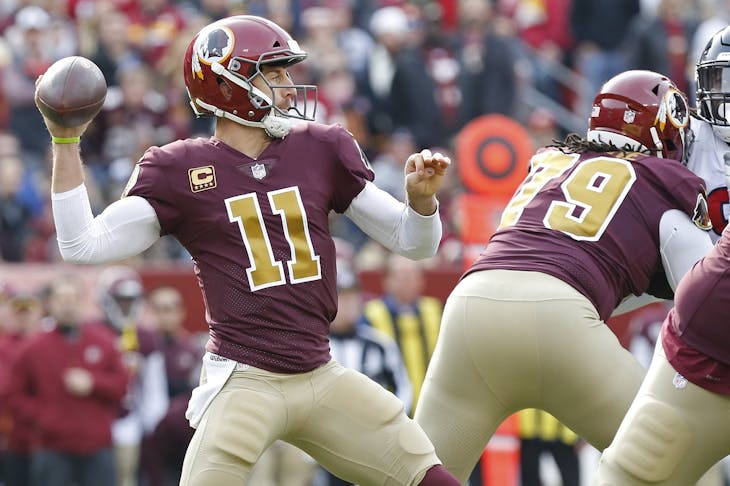
Below are the projections for quarterbacks. The "Overall" column is Steve Buzzard's projected roster percentage. The "Pros" column is the projection for professional, low-to-mid stakes GPP players on Draftkings. Finally, the "Diff Ratio" column is the difference between the "Pros" column and the "Overall" column, divided by the "Overall" column. It represents the proportional increase (or decrease) in pro roster percentage based on one or more factors listed in the introduction. So, for instance, Alex Smith's "+95.8%" means that various factors result in his pro roster percentage nearly doubling above and beyond Buzzard's projection.
| Quarterback | Team | Salary | Overall | Pros | Diff Ratio |
| Ryan Fitzpatrick | TB | 5000 | 1.6% | 3.3% | +108.0% |
| Alex Smith | WAS | 5600 | 1.7% | 3.3% | +95.8% |
| Sam Bradford | ARI | 5200 | 1.8% | 3.4% | +88.5% |
| Joe Flacco | BAL | 4900 | 2.1% | 3.8% | +79.5% |
| Case Keenum | DEN | 5100 | 2.4% | 4.0% | +66.1% |
| Ryan Tannehill | MIA | 5300 | 2.1% | 3.4% | +63.3% |
| Blake Bortles | JAX | 5600 | 3.8% | 5.7% | +50.3% |
| Andy Dalton | CIN | 5800 | 3.2% | 4.7% | +48.3% |
| Jimmy Garoppolo | SF | 5700 | 1.6% | 2.3% | +44.6% |
| Dak Prescott | DAL | 5500 | 2.6% | 3.1% | +17.4% |
| Philip Rivers | LAC | 6400 | 9.8% | 10.6% | +7.9% |
| Russell Wilson | SEA | 6200 | 2.8% | 2.8% | +1.7% |
| Tyrod Taylor | CLE | 5400 | 3.8% | 3.9% | +1.4% |
| Ben Roethlisberger | PIT | 6600 | 6.3% | 6.3% | +0.7% |
| Patrick Mahomes II II | KC | 6000 | 3.0% | 2.9% | -3.1% |
| Marcus Mariota | TEN | 6300 | 2.7% | 2.6% | -4.2% |
| Kirk Cousins | MIN | 6500 | 6.9% | 6.5% | -5.3% |
| Drew Brees | NO | 6800 | 10.8% | 9.8% | -9.6% |
| Andrew Luck | IND | 6100 | 5.0% | 4.3% | -13.9% |
| Tom Brady | NE | 7200 | 11.7% | 9.8% | -16.5% |
| Cam Newton | CAR | 6900 | 5.1% | 3.5% | -30.8% |
| Deshaun Watson | HOU | 6700 | 7.7% | 4.9% | -35.9% |
Alex Smith ($5,600, 1.7% Overall Roster Percentage, 3.3% Pro Roster Percentage)
Based on his salary and Draftkings point projection, Smith's probability of achieving 4x value is 27.5%, which ranks 6th of 26 quarterbacks in the Sunday Main slate. According to Steve Buzzard, Smith's opponent, the Arizona Cardinals defense, is only expected to be rostered in 1.7% of tournament lineups, which ranks 17th out of 24 defenses. Despite Smith's wide receivers only having an aggregate 3.7% roster projection, the aforementioned indicators nevertheless translate to Draftkings pros having nearly twice as much exposure to Smith as the overall public.
Philip rIVERS ($6,400, 9.8%, 10.6%)
Rivers' probability of achieving 4x value is 21.4%, which ranks 11th in the Sunday Main slate. The defense he's facing, Kansas City, is projected to be in only 1.0% of tournament lineups, which ranks 20th. Furthermore, Rivers' receivers rank second in aggregate projected roster percentage (28.0%), which ranks second behind only Pittsburgh's wide receiver corps (30.8%).
DeShaun Watson ($6,700, 7.7%, 4.9%)
Although Watson's wide receivers having a sixth-ranked 18.1% combined roster projection, Draftkings pros are likely to take a bearish position on him in Week 1. Watson's probability of achieving 4x value is a 19th-ranked 17.2%. In addition, the Patriots defense that he's facing ranks fourth in projected roster percentage.
cAM nEWTON ($6,900, 5.1%, 3.5%)
The only quarterbacks who rank lower than Newton in terms of 4x value probability are Week 1 backups Josh Allen and Josh Rosen. Meanwhile, only five quarterbacks in the Sunday Main slate rank lower than Newton with respect to the projected roster percentages for his wide receivers.

